Introduction
ag|knowledge is a REST API for mobile and web applications allowing easy access and integration of satellite remote sensing data & analytics into your agricultural application. The API provides access to field monitoring products for registered parcels (= fields or other plots of land). The data for each parcel will be immediately updated as soon as new measurements are available.
Typical image products are:
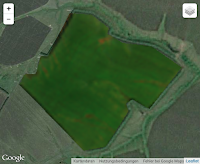
- Visible images (True colour images, RGB) of the parcel
- Live green vegetation indicator (Vitality images, NDVI)
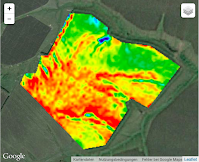
- Vegetation variations maps
- A variety of specialised vegetation indices providing more specific information about the vegetation status such as: Chlorophyll, Nitrogen or vegetation water content
This comes with:
- Time series of the above listed products including statistics
- History of up to 5 years
- Notification messages
- Preconfigured color maps
- Backend field object storage and management
- Geometry validation
- Open-Source Widgets for visualisation
For more details please see below or refer to the product pages: Basic Monitoring and Professional Monitoring.
This set of data is used by decision ready information products:
- Data Validation Package, making sure that your data will yield reliable results
- Crop Performance Monitoring allowing crop status and biomass monitoring and benchmarking
- Harvest Maturity monitoring supporting harvest planning and identifying the optimum quality of the produce
- Farm Management Zones for reducing inputs and increasing yield
- Agronomic Weather services to support your farming activities and yield prediction
- Pest and disease risk management to assess weather related risk (available for cotton)
For more comprehensive agroindustry Solutions and Applications see here
For further informations regarding our product pricing please refer here.
We support and speed up the integration of the ag|knowledge API into your application by Open Source Widgets. We also develop custom analytics based on our analytics engine, integrating state-of-the-art remote sensing and statistical analysis with AI technology. This allows us to achieve a high reliability of products required e.g. for crop maps, anomaly detection, forest water stress monitoring or specific crop markers. For own modelling and dedicated data analysis purposes we also offer access to the underlying index and raw sensor values. Radar data is also available on request. The functionality is constantly being updated.
Please have a look at our demo web client to get a first impression. We have a bunch of different visualization components available for free that can help you make the most out of the data.
Ag|knowledge is free of charge for development purposes. For operational use ag|knowledge is available on an annual subscription basis. A small fee per hectare and year will be charged. To obtain a developer account please contact us directly at support@geocledian.com.
Let us know your area of interest and give us an indication about the domain you want to use the service for. With a developer account you will also receive direct support for getting started.
Ag|Knowledge focuses on agriculture, but can also be used for forest monitoring or other tasks such as environmental monitoring. If you have any specific needs please let us know.
Basic Monitoring Package
If you are new to remote sensing technology, but want to demonstrate your customers the benefits of this technology, the Basic Monitoring Package is your starting point. It provides core functionality and services for easy integration of remote sensing in your application. It is easy to use and understand and can be very fast integrated into your application. For accessing the REST API you just need a user key and the base URL. Using the API is simple: register your parcel and seconds later you can retrieve the information stack available for it. This stack is updated as soon as a new sensor measurements are available. To further speed up the integration please have a look to our set of Open Source visualisation components on GitHub.
The sample syntax for parcel registration is:
POST https://geocledian.com/agknow/parcelsOnce the parcel is registered a number of products will be available. These can be accessed by a simple get request:
GET https://geocledian.com/agknow/parcels/<parcel-id>/vitality/<raster-id>The Basic Monitoring Package contains a number of products such as
- Visible (true color) Images
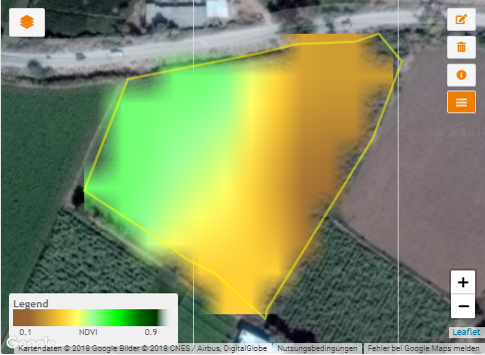
- Vitality Index (NDVI)
- Variations Map
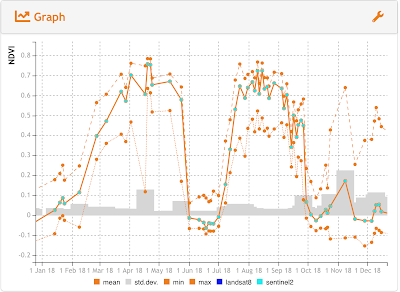
- Vitality Time Series statistics
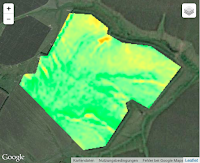
The Vitality Index statistics allow to visualise and interpret a time series of the parcel from seeding to harvest. The Vitality Image can also be downloaded as PNG or TIFF.
Use Cases: Basic Package for all applications
Professional Monitoring package
You understand Remote Sensing technology but don’t want to have the hassle of handling gigabytes of data daily? You want to develop your own algorithms and models? In this case you should have a look to the Professional Monitoring Package. It provides a wide range of specialised vegetation indices out of the box. Images, statistics, change detection and smoothed time series including visualization components. Access to the original reflectance data allows you to calculate your own indices or ask us to integrate them directly. We care about the data management at object level. A major concern is data quality. Outliers caused by clouds or cloud shadows are largely removed as well as mixed pixels at parcels borders. The standard set of indices comprises:
- NDVI – Normalised Defference Vegetation Index based on reflectance measurements
- NDRE1 – Normalised Difference Red Edge Index 1
- NDRE2 – Normalised Difference Red Edge Index 2
- NDWI – Normalised Difference Water Index
- SAVI – Soil Adjusted Vegetation Index
- EVI2 – Enhanced Vegetation Index 2
- CI-RE – Chlorophyll Index – Red Edge
- NPCRI – Normalized Pigment Chlorophyll Ratio Index
- BSI – Bare Soil Index
Other indices on request. Our reflectance product allows to access the raw reflectance values of the sensor for all spectral bands in GeoTIFF format.
Use cases: research, crop modelling, data analytics
Data Validation
All decision level products rely on correct input data. Faulty data may lead to wrong decisions or unjustified payments. To support our customers we provide a set of efficient data validation tools in our Data Validation Package. Parcels are the basic object Ag|Knowledge deals with. At registration time already the geometric properties of boundaries are checked and validated. The Land Use Homogeneity and Crop Cycle detection make sure that only one crop is cultivated in its boundaries and between the given sowing and harvest date. A generic crop type validation allows to identify easily parcels with wrongly declared crop types.
Use Cases: crop analytics, government subsidies control, insurance

Crop Performance Monitoring
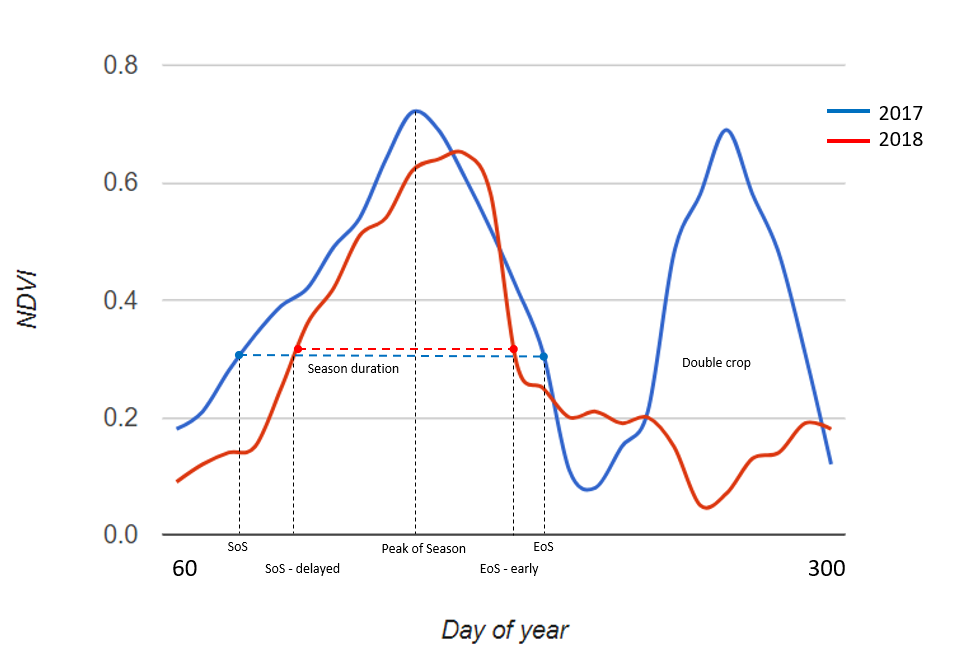
Determining the actual crop performance and in particular biomass in the field is of particular importance for managing crops. If not scientifically measured it remains guesswork and these measurements mean costs. On large farms or cooperatives you need to identify fields or farms which need attention. Our Crop Performance Monitoring product provides objective and fast tools for determining and comparing biomass and crop performance across fields and seasons. Key features are actual biomass development by index, including a field map and time series view, phenology markers, growth rate and duration, cultivated area determination as well as biomass benchmarking and comparison to nominal growth pattern of a crop.
Use Cases: crop growth management, risk management
Harvest Maturity and Scheduling
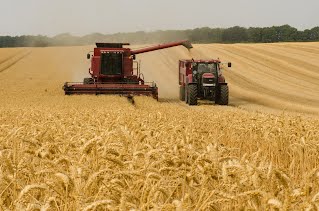
A wrong timing of harvest can cause significant harvest losses in quantity and quality. They occur if harvest happens too early or delayed – both scenarios are undesirable. Also fields may not mature homogeneously. During harvest time the availability of machinery is limited and needs to be planned carefully. We developed a Harvest Maturity Monitoring and harvest scheduling service using spectral indices sensitive to crop senescence. The start and progress of maturation per field is shown in a timeline. Maturity field maps differentiates the maturation status within each field. This information is used to determine the best harvest order of fields for better machinery use. With an individual crop calibration it may predict the optimal harvest dates to maximize crop yields as maturity approaches.
Optimising the harvest date is vital for all farm managers and farmers. The best harvest schedule and timing may improve yield by 5-10%. It also helps in mitigating restrictions in manpower and machinery availability, logistics and storage and thus saving costs at the same time.
Use Cases: harvest planning, yield optimisation
Farm Management Zones
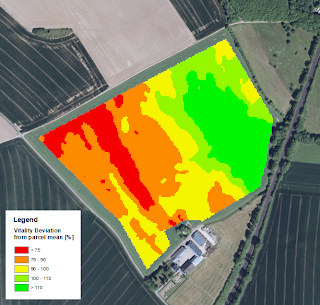
The Farm Management Zones is an important product for field management. It serves as basis for optimized soil sampling, fertilisation, irrigation or for planning other management actions. It allows to use fertilisers more efficiently, reduce run-offs, reduce number of soil samplings or improve irrigation.
No field is perfectly homogeneous. Managing and in particular fertilising each sector the same may mean wasting inputs on the one side while undersupplying crops on the other side. Our Farm Management Zones Map identifies the homogeneous zones within a field representing different soil characteristics and yield potentials. This is the basis for precision farming. By evaluation sensor images from previous seasons the zones with previously similar characteristics are derived. Zones with higher fertility are shown in green, followed by the medium zone colored in yellow, zones with lower fertility are displayed in red.
Use Cases: nutrition advisory
Agronomic weather
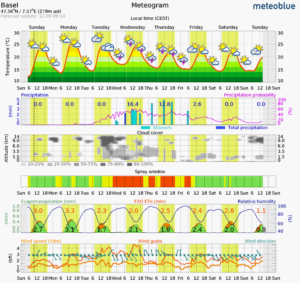
Weather and soil are the two main influential factors in crop development. Free weather forecasts are helpful but are often not accurate enough and do provided some essential information. We offer high resolution Agronomic Weather at field level to support your farming activities, crop modelling and yield prediction. This not only includes a 7 day forecast but also a full weather history for any location. Parameters include temperatures (mean, min, max), precipitation, wind, humidity, dew point, soil moisture, soil temperature evapotranspiration and solar radiation on a daily basis (hourly on request). Weather has a big impact on farming activities like spraying, harvest planning, but is also essential for irrigation planing, crop modelling, pest and disease risk assessment and yield prediction. Such decision ready services will be made available in near future.
Use Cases: farm management, crop modelling, yield prediction, insurance
Pest and disease risk management
Pests and diseases pose a major thread to crops. Intelligent methods allow to predict the level of risk especially for diseases but also for pests. Our weather based risk models give an indication if the preconditions for a certain pest or disease exist or not. For most crops specific risk models can be configured. Currently we support risks models for cotton containing:
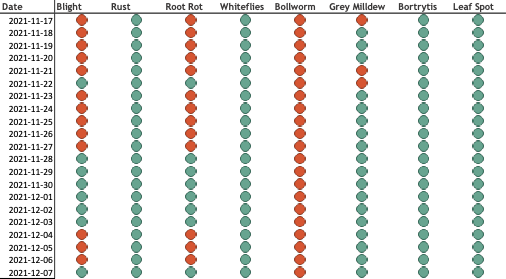
- Blight
- Rust
- Root Rot
- Whiteflies
- Bollworm
- Grey Milldew
- Bortrytis
- Leaf spot
Use Cases: farm management, risk management
Radar Products
Sentinel-1 radar products are available on request in our agknowledge API. The advantage of radar products is that they are available independent of cloud coverage and can therefore increase data availability in cloudy regions, e.g. for crop mapping & monitoring or prediction models.
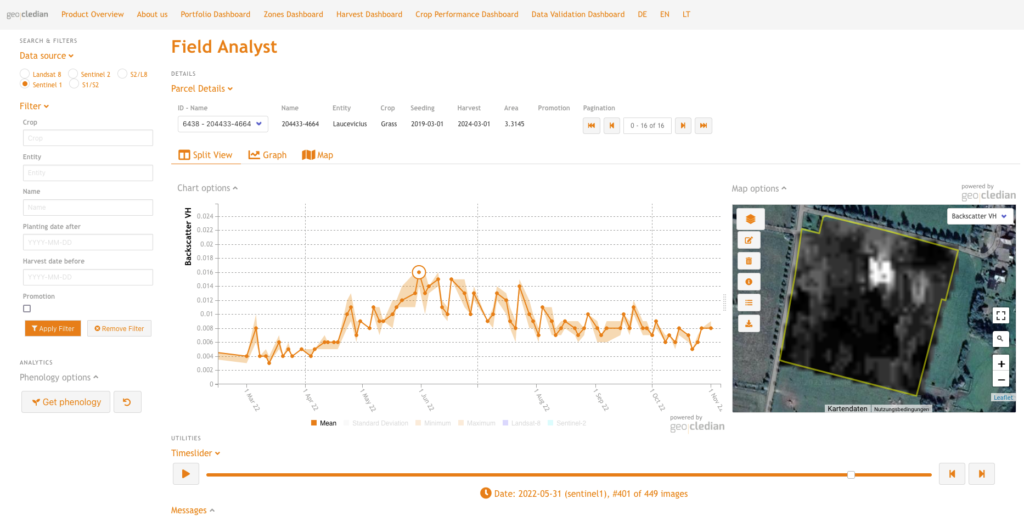
Use Cases: crop classification, flooding
Custom services
Geocledian supports you with customised services. Every crop and region is different, every user has specific needs. As we are specialists in analysis of remote sensing and geographic data we provide customised algorithms, crop specific calibration, validation or just in individual data analysis. Below some examples
Crop type verification
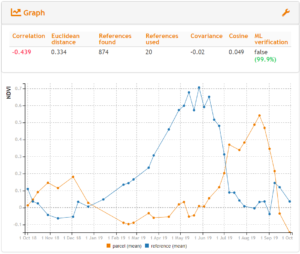
Integrated and pre-trained machine learning algorithms to identify or verify planted crop types and other labeled datasets. We support a range of different approaches internally, from untrained verification by similarity analysis to highly accurate crop identification. The latter achieves the best accuracy but requires custom training with reference data sets.
Use Cases are subsidies controls and IAC Systems.
Outlier & Anomaly detection
Our Outlier and anomaly detection feature compares fields with its neighbours and provides information whether a crop field is deviating from the norm due to different management practices, weather conditions, pests, delayed sowing or drought.
Use Cases: Portfolio Management.
Other important information
Update Frequency
The underlying sensor data will be updated every few days mainly depending on the local weather conditions and the geographical latitude. Without clouds you typically get new images every 3-5 days. Generally it can be said the further North or South of the Equator the higher the revisit rate but the worse the cloud situation. More arid areas will be updated more frequently than humid areas.
Ground Resolution
Since 2016 the native resolution has increased by a factor of 9. One pixel measured by the best satellite sensors we use covers an area of approx. 100 m2 (10 m x 10 m) Thus for a parcel of the size of 1 ha approx. 100 measured points (pixels) are available. The minimum parcel size should currently be not below 0.2 ha or 0.5 acres. It has to be taken into account that pixels from the border of the parcel may contain significant signal components from neighbouring objects and thus are not representative. These pixels will be filtered in our products. On request we can also integrate commercial HHR or VHR data.
Geographical Areas Covered
The service works globally and is fully operational. We are setting up the areas you request within a few days if it is not already available on or data base. We are already routinely covering large areas in Europe and Africa and India.
Image Formats
Supported image formats are PNG for visual images and GEOTIFF for measured values. In general the imagery is geocoded to Google Mercator projection (EPSG: 3857) and can be directly used within various map frameworks such as Google Maps, Mapbox or OpenLayers. The API supports also other image formats and projections on the fly.
Attribute information will be delivered in JSON format, coordinate data as GEOJSON or WKT.
Remote Sensing Basics
Here you can find more remote sensing basics.
This web service is provided to you by geo|cledian. All rights reserved ©2021 geo|cledian.