Transforming satellite data measurements into reliable information is not a trivial task. Identification and verification of major farming activities like seeding, planting or harvest is essential to further analysis and data integrity. Our phenology product enables the derivation of phenological parameters through the analysis of the time series per one parcel. It allows to verify the integrity of the parcel and determine and compare growth rates or peak values by using tested and verified algorithms. Core benefits are:
- automatic detection of major farming activities like Start of Season (SoS), End of Season (EoS) / Harvest
- detection of number of crops cycles
- verification of parcel integrity (land use homogeneity)
- verification of manually recorded seeding and harvest dates
- compare phenology parameters of different parcels
Product: Markers
It derives automated phenology markers such as Start Of Season (SOS), Peak of Season (POS) and End of Season (EOS).
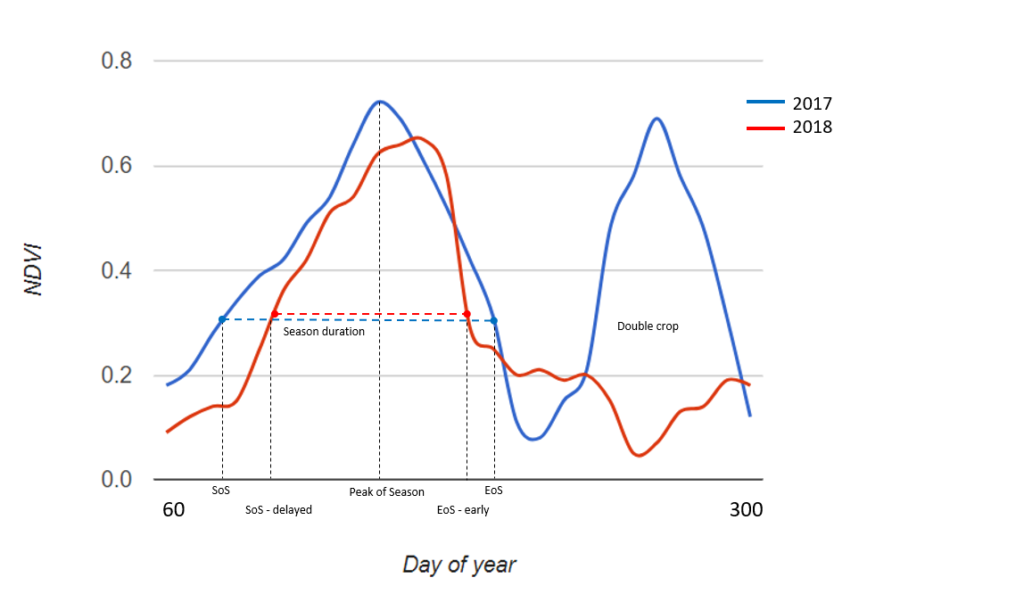
These markers are used in many different ways:
- SOS: check and verify planting/sowing dates (e.g. do determine a delayed or early season)
- POS: check the date of the seasonal peak
- EOS: check and verify harvesting dates (e.g. for transport planning, harvesting schedules, combine availability)
- quantify the season duration (e.g. a too short season may be the result of a drought or crop disease)
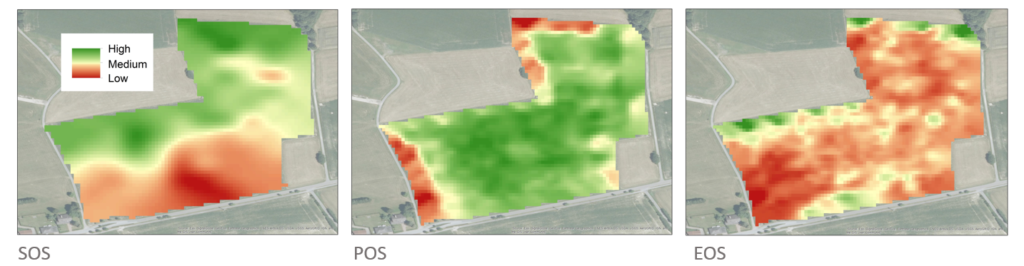
A visual inspection of the phenology marker dates SOS, POS and SOS provides an insight on the different seasonal and land management patterns (e.g. emergence, ripening and harvest):
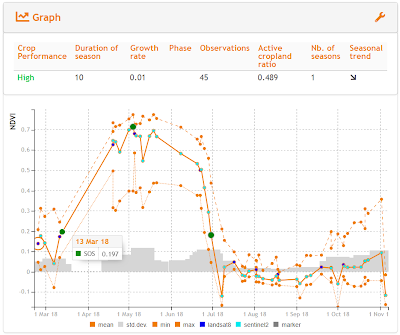
Our web client provides a phenology dashboard and a visualization of the phenology markers (which are also accessible through the API):
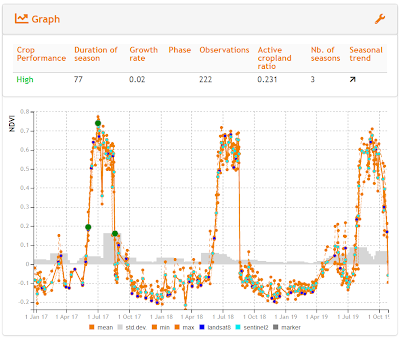
The phenology function is also used to determine the number of seasons (i.e. number of harvest) of the monitoring period. This is an indicator of cropping intensity and provides answers to the question: „How many crop rotations have taken place during a specific period?“. Our algorithm identifies multiple local maxima, depending on the number of peaks in the vegetation index time series. The following example is a crop with 3 sequential seasons where the markers (green points) are derived for the first season, and the number of seasons are identified as 3:
Product: Growth Rate
Another indicator for crop performance is the growth rate (i.e. daily decrease or increase of biomass, quantified by a vegetation index).It is the slope between the SOS and the POS. Some crops are known for a slow growth (cotton) whereas rice or maize have a rather fast and steep growth. The growth rate can be used as an indicator for water stress or crop disease when a too slow growth rate is identifed than expected.
As any time series can often be high dimensional, with theoretically more than 120 temporal features per year, the phenology function enables the reduction of a magnitude of information to the most significant and informative features which can be summarized in a set of seasonal statistics such as area under curve (integral), min, max, standard deviation, mean, kurtosis, skewness and others.
Product: Land Use Homogeneity
With the additional analytical crop status, our API provides the derivation of the actual area under crops (net cropland area). In most cases the size of the parcel or registered agricultural land overestimates the area under crops due to a variety of reasons:
- deviation in sowing
- deviation in nitrogen application
- deviation in irrigation practices
- soil salinity
- water-logging
- failed crops
- water stress
In the following example, for a single requested date, the actual area under crops is derived based on a per-pixel analysis within the field. Only 35.8% of the parcel are under crops at time of the sensing date (August 29th 2018). The actual area under crops is then indicated as 2.87 hectares.
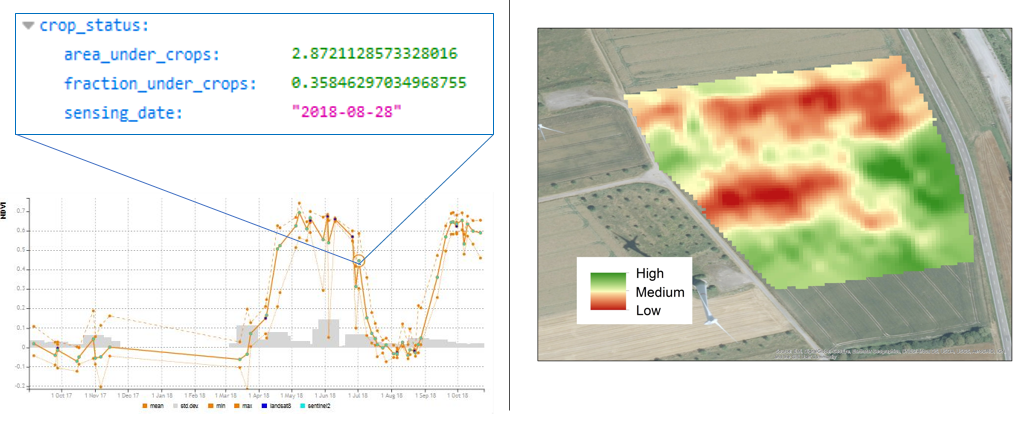
For more details see also: CropStatus