EU Deforestation Regulation Compliance

The EU regulation on deforestation-free products – EUDR and agroforestry certifications such as Rainforest Alliance and the Roundtable on Sustainable Palm Oil Standards (RSPO), require the proof that no deforestation has taken place. The EU regulation on deforestation-free products requires the proof for beef, cocoa, coffee, palm oil, soy, wood and derived products like leather and furniture. Thus, two main capabilities are required which we both offer:

  1. Geolocating of all plots affected. Plots can represent permanent plantations, but in case of beef and soy also pasture and agricultural fields. Mapping of specific crops is provided in our mapping service
  2. EU Deforestation check which is described below.

Based on these requirements we have developed a deforestation and land conversion analytical product on parcel level. Our service is based on high frequency satellite imagery from our Ag|knowledge platform and other auxilliary datasets.

EUDR SatCheck Service

The EUDR SatCheck product is an automated deforestation assessment tool providing support to fulfil the EUDR requirements for the affected commodities such as geolocalisation, polygon management and EUDR deforestation risk assessment within the production time range. It provides auditable information based on remote sensing data and derived products. If the internal model detects forest at the cut-off date of the EUDR on the registered area it will mark this polygon with a potential high risk of deforestation. Additionally, it will provide an index indicating the likelihood of deforestation. The deforestation is checked against the reference date 2020-12-31 as required by the EU.
The EUDR SatCheck product can be easily integrated into existing Traceability systems or other IT systems because of its standards based REST-API (OpenAPI) and provides the result of the EDUR SatCheck as a JSON response. The process is fully automatized: after the polygon is registered and the processing is done you can retrieve the result with a single request to our API.

Detailed product description

The JSON response will include the latest satellite image date available (sdate) and the date of the closest satellite image available for the baseline date of 2020-12-31 (baseline_date). Furthermore the relative area of landcover detected on the registered polygon (landcover) is part of the response. The potential deforestation risk (deforestation_risk) will be classified as low, medium or high depending on the landcover results. Additionally the likelihood of a deforestation on the polygon area is provided as an index (deforestation_index) between 0 (no deforestation) and 100 (completely deforestated). For visualisation purposes links to the satellite data used are provided on the polygon level comprising the True Color Image (RGB) of the latest satellite image date available (rgb_png_sdate) and the closest satellite image available for the baseline date of 2020-12-31 (rgb_png_baseline_date). If the deforestation risk was classified as medium or high a link to the change detection analysis is provided (change_png).
The EUDR states that all countries will be assigned to a specific risk level (country_risk). Currently all countries have been assigned to a standard risk level until the EU publishes a detailed list with a dedicated risk level for each country. The internal algorithm used is stored in a version tag (model_version), while the date of the EUDR SatCheck generation result is also available (generation_date).

The API documentation tells you more about the technical area registration process and you can access also a live demonstration of the EUDR SatCheck service.

Demo App EUDR SatCheck

Additionally to the automated assessment for EUDR compliance for each plot we provide a visual proof through comprehensive satellite image time series as can be seen in the image below including a change detection map. Thus, proper documentation for EUDR compliance is provided down to the plot level.

Satellite image time series for a palm oil plantation plot

Technically we work with a high quality scientific land cover dataset, optical and radar satellite data and change detection methods. Usually, agroforestry and forestry systems are characterized by a very constant high intensity vegetation index (e.g. NDVI) values in tropical climates. An abrupt change in the NDVI time series is an indicator for a logging event if not caused by a natural disaster (i.e. storm damage). These changes are automatically detected by the platform in our Change product and constantly monitored.

Change detection

Large scale Mapping and custom deforestation solutions

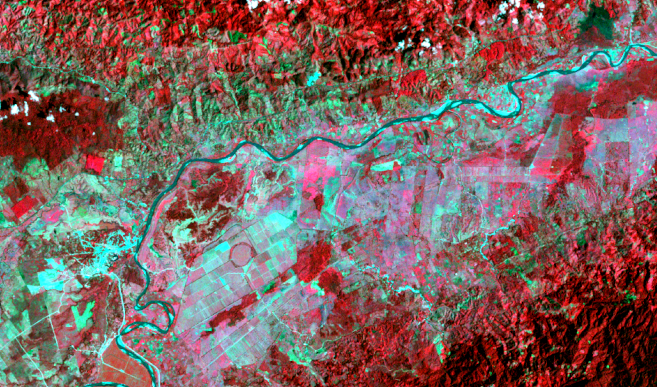
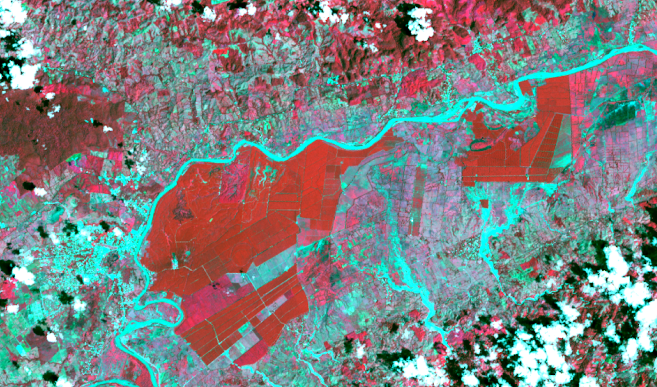
We also offer large scale land use mapping services to detect deforestation and land conversion events according to custom requirements in the last 30 years based on historical data.

References

Deforestation assessment of multiple palm oil plantations in Central America for the Bext360 traceability platform, provided through AgKnowledge API. For each plantation plot the proportion of each land use class before the conversion has been determined. The time span analysed was between 10 and 20 years.