What are the parcels with the highest biomass volumes? Determining the crop performance and in particular biomass in the field is of particular importance for many crops. If not scientifically measured it remains guesswork and these measurements mean costs. On large farms or cooperatives you need to identify fields or farms which need attention. Key features are actual biomass development by index, including a field map and time series view, phenology markers, growth rate and duration, cultivated area determination as well as biomass benchmarking and comparison to nominal growth pattern of a crop.
Our crop performance dashboard can help to answer these questions and analyse the crop performance of individual fields:
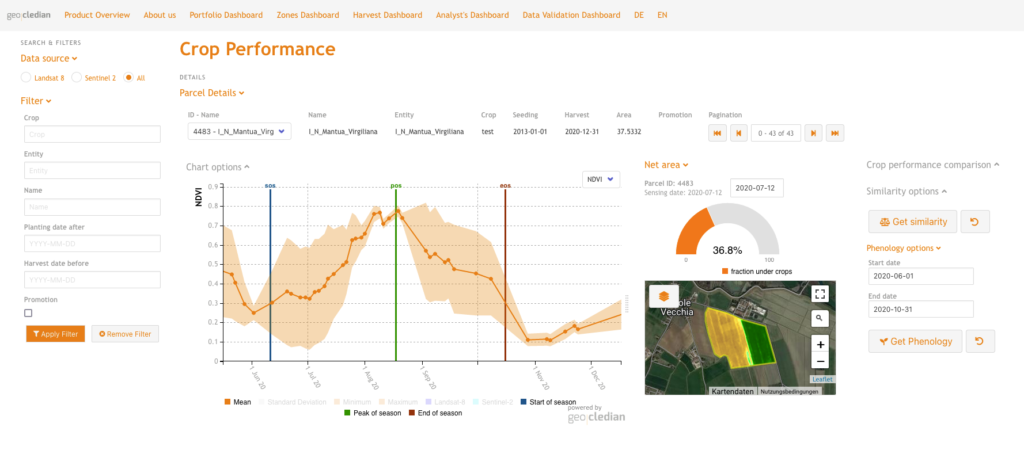
It is based on the agknowledge API products of the Crop Performance package.
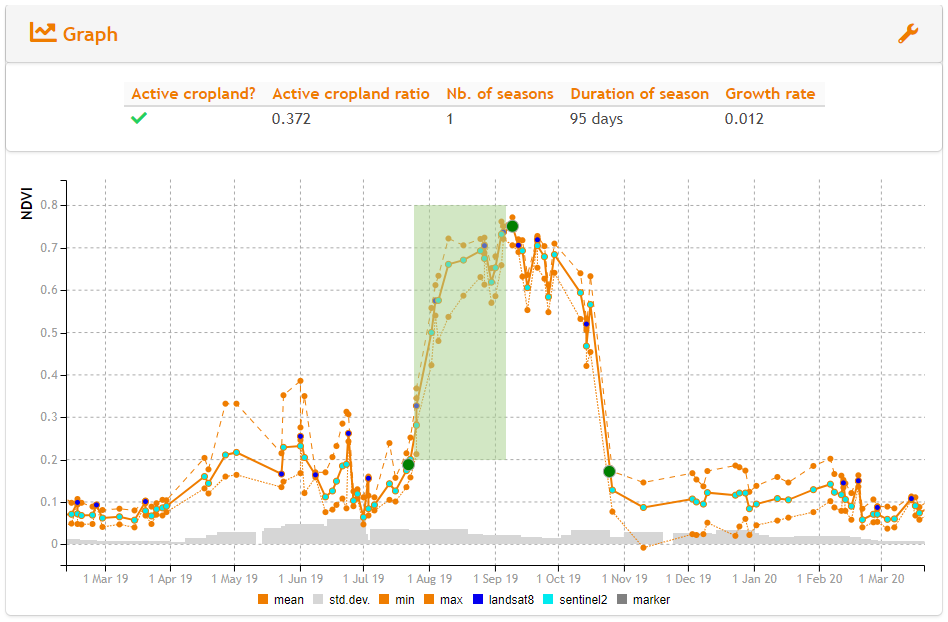
You can use time series parameters of the phenology package like start of season (SoS) or peak of season (PoS) together with specific vegetation indexes for detecting anomalies or your best performing fields. With this functionality a multitude of benefits can be achieved:
- compare and rank biomass development across fields
- find anomalies
- identify fields which need better management/treatment
- identify farmers which need support
- monitor relative biomass per field as proxy to yield
- compare with biomass of previous seasons (yield)
- identify and compare yield potential across fields
- create performance profiles for seed varieties
- reduce input costs
- reduce field staff
- improve yield prediction
Product: Phenology
The Phenology functionality can be found here
Product: Cultivated Area
The Cultivated Area description can be found here
Product: Biomass Index
Spectral vegetation indices from multispectral satellite imagery are not direct biophysical measurements, but are highly correlated with biophysical variables such as LAI and FPAR. Moreover, Remote Sensing based vegetation indices are very often used for the estimation of crop leaf biomass or dry matter through regression analysis based on in-situ data. Some frequently used spectral indices however, saturate when certain biomass volumes and crop canopy densities are reached. Before this point, they provide meaningful information on biomass volumes for specific crop types.
Our method is based on work from several researchers that prove that red edge indices such as the CIRE (from Sentinel-2 data) is suitable for a regression analysis of above ground biomass (AGB) and derives better results than other vegetation indices (Fu et al. 2020, Bekkema et al. 2018, Clevers et al. 2017, Delegido et al. 2011, Dong et al. 2015, Sibanda et al. 2015, Cammarano et al. 2014).
The majority of research states that Biomass accumulation influenced mainly simple ratio or normalized indices, while indices that contained red-edge wavelengths were more able to predict canopy N parameters. Among all the vegetation indices studied, chlorophyll-related indices were the best for robustly estimating canopy N-content because it is based on a two-dimensional approach that compensates for an increase in canopy biomass, and it includes the red-edge, which is sensitive to slight changes in canopy N.
We have therefore developed a biomass indicator based on state-of-the-art research and scientific literature.
Product: Biomass Benchmarking
The biomass index is used to rank agricultural parcels based on their expected green (leaf) above ground biomass. The ranking must take place before the Peak of Season (POS) which is indicated as a phenological marker through our API.
The time window for retrieving the biomass ranking is therefore given between the Start of Season (SOS) and the POS – however, the recommended time is either at the POS or shortly before this date (e.g POS – 14 days).
The general approach would be to first have a general information on the POS date of the respective crop type. This can be requested through our /phenology/ endpoint and used as an input date variable for the ranking function and request the CIRE (or the NDWI, depending on crop type) spectral index and select the ordering parameter as „desc“ (descending): the parcels will be then ranked according to their biomass volumes for the requested date, starting with the parcels with the highest expected crop leaf biomass. Parcels at the lower end of the list are identified with lower crop leaf biomass volumes and a potential lower crop performance.
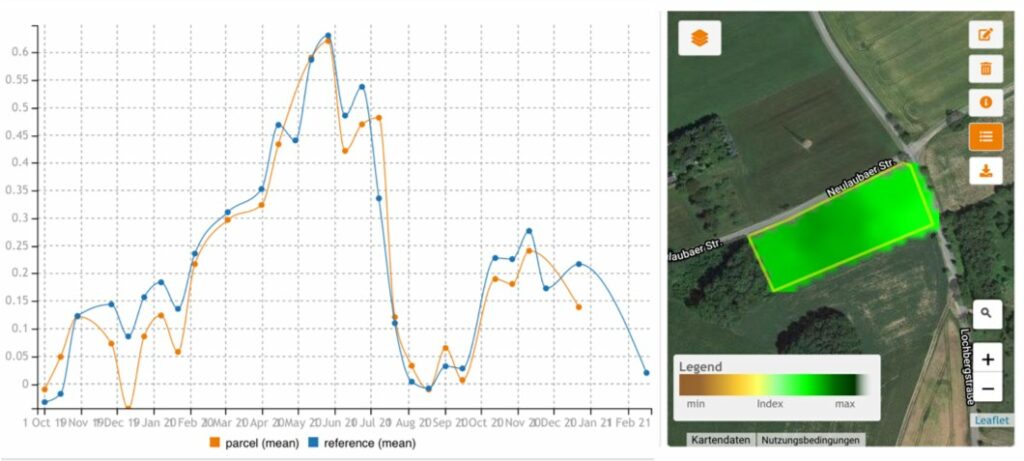
Product: Nominal Crop Growth
It allows to compare the crop growth pattern of the respective parcel with the nominal crop growth pattern of this crop in the geographic neighbourhood. With this tool anomalies and abnormal growth development can be more easier detected.
References:
- Delegido J, Verrelst J, Alonso L, Moreno J. Evaluation of Sentinel-2 red-edge bands for empirical estimation of green LAI and chlorophyll content. Sensors (Basel). 2011;11(7):7063‐7081. doi:10.3390/s110707063
- Clevers, J.G.P.W.; Kooistra, L.; Van den Brande, M.M.M. Using Sentinel-2 Data for Retrieving LAI and Leaf and Canopy Chlorophyll Content of a Potato Crop. Remote Sens. 2017, 9, 405.
- Fu, Z.; Jiang, J.; Gao, Y.; Krienke, B.; Wang, M.; Zhong, K.; Cao, Q.; Tian, Y.; Zhu, Y.; Cao, W.; Liu, X. Wheat Growth Monitoring and Yield Estimation based on Multi-Rotor Unmanned Aerial Vehicle. Remote Sens. 2020, 12, 508.
- Sibanda, M.; Mutanga, O.; Rouget, M.; Kumar, L. Estimating Biomass of Native Grass Grown under Complex Management Treatments Using WorldView-3 Spectral Derivatives. Remote Sens. 2017, 9, 55.