You want to professionally use and analyse remote sensing time series data in your application, but need ready to use data at object level? You need a superior data quality and tools? The Professional Monitoring package allows you to access various professional satellite data indices and reflectance data sets. Enhanced data quality by removing border pixels containing mixed spectral signals and time series outlier filtering. Including images, statistics, change detection and smoothed time series including visualization components. We care about data persistence to allow fastest data retrieval with unlimited number of API requests. The core benefits of Professional Monitoring are:
- Professional indices
- Calibrated reflectance data (TOA and BOA)
- Historic data provision
- Outlier filtering and border pixel removal
- EO data management and persistence
- Support of geographic projections and transformations
- Supporting Sentinel 2 data
- Near realtime updates
- Easy integration and sample code
- Multiple colormaps per index
- Professional data quality
- Change detection
Product: Specialized Vegetation Indices
Characteristics: In addition to NDVI we have a variety of selected vegetation indices in our professional monitoring package that can be used for dedicated applications.
Use Cases: These indices allow the derivation of Chlorophyll, Nitrogen, water stress or other special products for your crops. Here we try to give a brief overview about each vegetation index and potential applications:
| Index | Name | Application | Used bands | Value range | Example |
| NDVI | Normalized Difference Vegetation Index | Vegetation vitality. NDVI correlates with the amount of leaf area (LAI) of active, healthy, green vegetation. Advantage: The most widely used vegetation index. Disadvantage: It saturates at high LAI levels and therefore shows limited variation in dense fields with high biomass. It minimizes topographic effects. Negative values of NDVI (values approaching -1) typically correspond to open water. Values around zero (-0.1 to 0.1) generally correspond to bare soil, barren areas of rock, sand, or snow. Low, positive values represent low or sparse vegetation (approximately 0.2 to 0.4), while high values indicate dense vegetation (values approaching 1). Native resolution: 10m | Red (B04) & NIR (B08) | [-1; 1] | |
| NDRE1 | Normalized Difference Red Edge Index (v1) | The Red Edge Indices are designed to estimate chlorophyll content in the canopy. More sensitivity in vegetation with high LAI. Less sensitivity to open water. There are several different formulas for the NDRE index. We selected the most appropriate ones. Native resolution: 20m | Vegetation Red Edge 1 & 2 (B06 & B05) | [-1; 1] | |
| NDRE2 | Normalized Difference Red Edge Index (v2) | The Red Edge Indices are designed to estimate chlorophyll content in the canopy. More sensitivity in vegetation with high LAI. Less sensitivity to open water. There are several different formulas for the NDRE index. We selected the most appropriate ones. Native resolution: 20m | Vegetation Red Edge 1 & 3 (B07 & B05) | [-1; 1] | |
| NDWI | Normalized Difference Water Index | Sensitive to Vegetation water content & water stress. Allows drought monitoring. NDWI is less sensitive to atmospheric effects than NDVI. Attention: There are also other „NDWI“ indexes with different meaning. Native resolution: 20m | NIR (B08) & SWIR 1 (B11) | [-1; 1] | |
| SAVI | Soil Adjusted Vegetation Index | Reduced soil background effects. SAVI tries to correct for bare soil areas in the field. Therefore it is interesting in sparse vegetation canopies or early growing stages. Native resolution: 10m | Red (B04) & NIR (B08) | [-1; 1] | |
| EVI2 | Enhanced Vegetation Index 2 | More sensitivity in late growth stage (high LAI). It tries to correct for soil background signals and atmospheric influences. Native resolution: 20m | Vegetation Red Edge 1 (B05) & Narrow NIR (B8A) | [-0.735; 1.25] | |
| CI-RE | Chlorophyll Index – Red Edge | Very high Chlorophyll & Nitrogen sensitivity. Canopy Chlorophyll & Nitrogen contents can be derived for a wide range of crops (e.g. potato, soybean, maize) and grassland. This can be used to plan harvests. Native resolution: 20m | Vegetation Red Edge 1 & 3 (B07 & B05) | [-1; ca. 9] | |
| NPCRI | Normalized Pigment Chlorophyll Ratio Index | Associated with chlorophyll and nitrogen content. This index can be found in precision agriculture applications. Crops with a low Nitrogen content can have a high carotenoid to chlorophyll ratio. Using the red and blue spectral bands, NPCRI captures the information needed to quantify chlorophyll and Nitrogen. Native resolution: 10m | Blue (B02) & Red (B04) | [-1; 1] | |
| BSI | Bare soil index | This index indicates the amount of bare soil per pixel. Native resolution: 10m | Blue (B02), Red (B04), NIR (B08), SWIR 1 (B11) | [-1; 1] |

Min (Index) Max
Depending on the index the colormap visualises different value ranges.
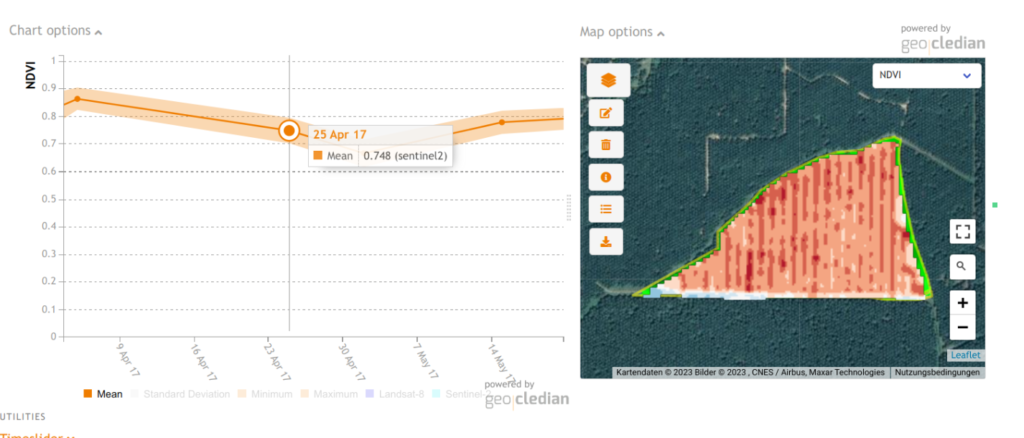
Product: Time Series Statistics
Characteristics: All index products are provided with time series statistics at object level. The statistics contain mean, min, max, std-dev and count values and can be smoothed and outlier-filtered.
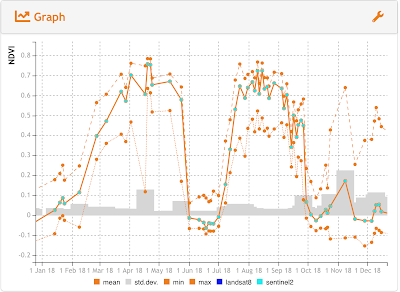
Use Cases: Analytics at object level
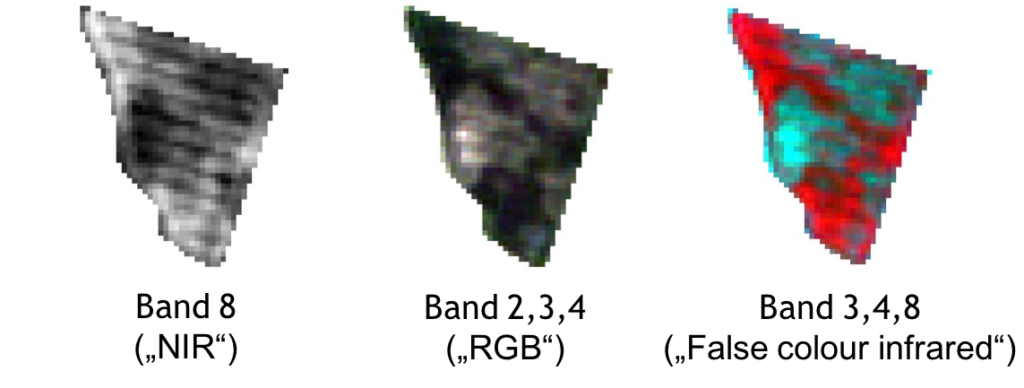
Product: Reflectance tif
Characteristics: The reflectance product allows to access the raw reflectance values (Top Of Atmosphere – TOA and Bottom of Atmosphere – BOA) of the sensor for all spectral bands. The image format is GEOTIFF.
Use Cases: The Reflectance product serves as input for modelling or dedicated data analytics.
Product: Change detection
Characteristics: Our change product allows to produce change detection images from any 2 products of the same vegetation index in no time and integrate them live in your application. You have the choice between a difference or ratio calculation.
Use Cases: Change detection at object level, e.g. deforestation or harvest detection
Feature: Improved Data Quality
Characteristics: Data quality is improved by two automatic processing tools. To obtain a clearer radiometric signal for the object, border pixels are first removed and then extrapolated for visualisation. This is applied before statistics calculation. Tiff images are delivered without border pixel removal.
For the time series statistics of all spectral index products except NDWI and CIRE, cloud flags (date markers) are provided with the additional query parameter „&clouds=true“. The cloud and cloud shadow detection algorithm is dynamic and its output is a list of data points from the time series which were contaminated by clouds and cloud shadow pixels after the initial cloud masking (which is always used by default).
Through this, such data points can be removed from further analysis or can be removed or flagged in any time series visualization client.