Practically, no agricultural field is homogeneously cultivated – thus, different zones within the field have different yield potentials and need different management practices. Based on Vegetation Indices from Earth Observation data, our Farm Management Zones product allows you to localize and assess such zones and their varying agricultural productivity and use these variable rate application (VRA) maps for precision farming or smart farming.
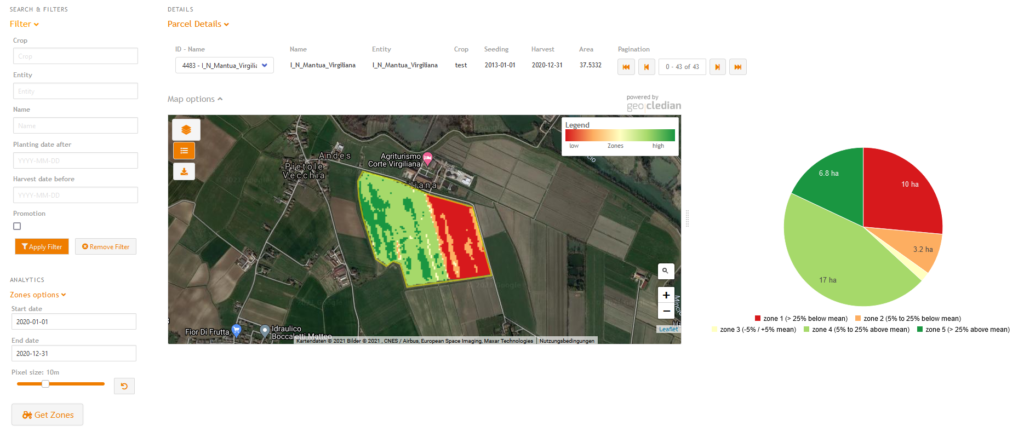
Our Zones Dashboard showcases our Farm Management Zones product for individual fields:
Variations in crop growth can be caused by natural conditions, for example:
- different soil quality and soil type zones resulting in different crop growth patterns and crop productivtiy
- different water availability caused by heterogeneous soil and terrain conditions
- partially damaged crops or partial crop losses due to local hail or floods (or other natural hazard events)
However, there is also a whole spectrum of management- and human-induced reasons such as:
- heterogeneous sowing resulting in different crop row and canopy density
- variations in irrigation, fertilizer and chemical application
Monitoring these zones during the season can be used to improve irrigation and fertilization practices. The derivation of zones with varying agricultural productivity also servesas input for yield modelling through the identification of potential crop yield gains or losses respectively.
Localizing partial crop losses or decrease in productivity gives important insights on overall agricultural performance and actual yield gaps that differ from potential gross yields. Such information is crucial to update yield estimations (and thus, to adapt logistical needs for the harvest) and to quantize crop losses for affected farmers and producers.Our Yield Potential Maps show you the different zones within each field during the actual season or for any previous season. This can bring you the following benefits:
- optimize irrigation and fertilization management (reduce inputs and improve sustainability)
- reduce costs for soil sampling
- optimise crop yields
- monitoring and estimation of actual biomass as a proxy to yield prediction
- identifying fields which need better management/treatment or experience crop losses
Product: Management Zones Map
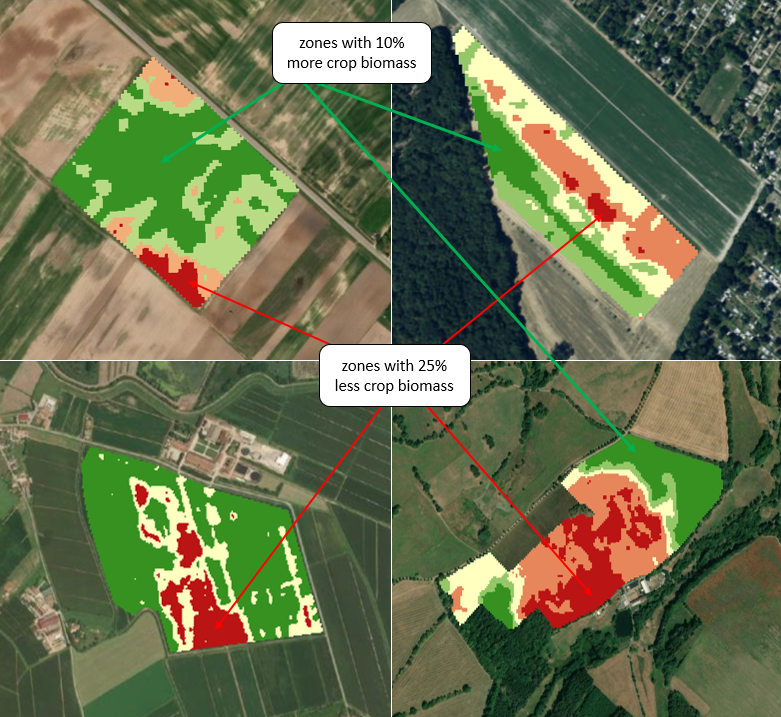
Characteristics: The management zones map provides the Field Managment Zones that are needed to apply precision farming actions specifically. By combining all images available during a user defined period of crop development the zones with similar characteristics are derived. Zones with higher fertility are shown in green, followed by the medium zone colored in yellow, zones with lower fertility are displayed in red.
Use Cases: The Management Zones Map is an important product for field management. Even if the map itself doesn’t provide the reasoning for such differences it serves as basis for optimised soil sampling, for fertilisation for irrigation or for planning other management actions.
The calculation of FMZ contains a two-fold methodology:
- „along-the-season“: provides zoning maps for the current agricultural season, for variable rate application
- „longterm“: provides zoning maps based on historical data from the last few agricultural seasons or years, in order to localize the overall field potential