You want to integrate satellite remote sensing data into your application or workflow, but you do not have the time or only limited knowledge how to do it? You do not want to bother with daily gigabytes of remote sensing data for your limited number of agricultural fields or other monitoring objects? Our Basic Monitoring package allows you to easily integrate remote sensing data and derived information into your application at parcel level. We care about object data management and persistence to allow fast data retrieval. You do not need to bother about data updates and notifications keep you informed when updates have happened. Basic Monitoring provides ready to use processed data at object level. The main benefits are in brief:
- Easy start and fast integration
- No processing or storage of EO data required
- Geometry data validation
- Object based data management and persistence
- Automated updates and update notifications
- Sample code to simplify integration
- Professional data quality
Product: Object registration and persistance
We provide a REST API supporting typical GET, PUT and DELETE commands. For accessing the API you need a user key and the base URL. Using the API is simple: register your parcel and after a short preparation phase you can retrieve the information stack available for it – extremely fast and with unlimited number of API calls. This stack is updated as soon as new sensor measurements are available. Demo clients and open source widgets help you in data visualisation.
To register a parcel it is required to provide:
- the geometry (geographic coordinates) of the parcel
- the crop type
- seeding / planting date
- (planned) harvesting date
It is also recommended to provide a unique parcel and farm name for your identification. Monitoring will start 4 weeks before the planting date and automatically stops 6 weeks after harvest. Please note that it makes most sense to register parcels with one single crop and one season. Object life longer than one year is not supported in the Basic Monitoring. Parcels with mixed crops can be used too, of course, but some API functions may not deliver the expected results.
The sample syntax for parcel registration is:
POST https://geocledian.com/agknow/parcelsOnce the parcel is registered a number of products will be available. These can be accessed by a simple get request:
GET https://geocledian.com/agknow/parcels/<parcel-id>/vitality/<raster-id> Object data remains available also after harvesting date* at no extra cost until you delete it or you terminate your subscription (*for maximum 5 years).
Products: Visible Image, Vitality Index, Variations Map
The Basic Monitoring Package contains a number of products such as
- Visible (true color) images
- Vitality index map
- Variations map
- NDVI time series statistics
- Colormaps
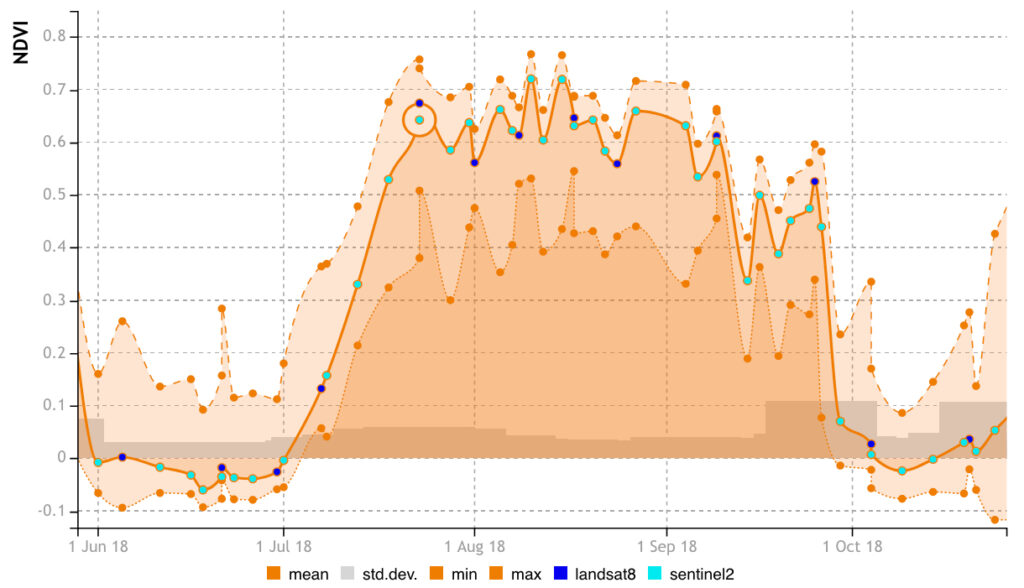
The Vitality or NDVI statistics allow to visualise and interpret a time series of the parcel from seeding to harvest. The NDVI image can also be downloaded as PNG or TIFF. The NDVI float tif product serves as input for modelling or dedicated data analytics. Clouds, shadows and other outliers are filtered out.
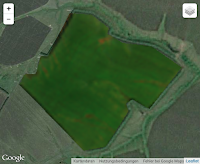
Visible (True colour) image
Characteristics: The visible (true color) image is also called an RGB (Red-Green-Blue) image according to the spectrals bands it is composed of. It shows the latest visual image of the parcel, but also all previous images can be obtained. The product is representing the normal visible colours of the object like in a photo. Light and dark green colours usually represent vegetation. Brown colours either represent open soil or ripe crops. Light brown (beige) colours may represent fully dry ripe crops or harvested fields with stubbles still on the field. Specific colours can occur during blossom. The image is generated from reflectance values derived from the visible spectral bands of the satellite sensor.
Use Cases: The visible RGB image is an easy to understand product for non experts. It corresponds to the visual experience in the field. By visualising a time series the crop growth status can be roughly detected on these images. Also vegetation irregularities are already visible. Particular attention needs to be payed to brown colours. Bare soil and ripe crops may look similar. A time series of images is required to allow for distinction.
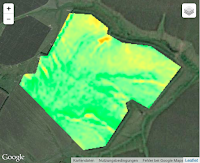
Vitality index
Characteristics: It is a valuable quantitative vegetation monitoring tool used as indicator for the vitality of a crop in particular for the live green vegetation. Its value also strongly depends on the percentage of area covered by leaves. To generate the Vitality image an absolute colour table is applied to the calculated NDVI (Normalised Difference Vegetation Index) index values, which are ranging from -1 to 1. Dark brown represent low NDVI values on bare soil or water (close to 0 or below), yellow colours have been assigned to medium values (low vegetation). Green colours for high values are close to 1 and represent high, vital vegetation. The image is generated from reflectance values derived from the visible and near infrared spectral bands of the satellite sensor. The NDVI can be influenced by the atmospheric conditions and soil moisture.
Use Cases: The vitality image is also usable for non experts as it is similar to the visible (true colour) representation. It shows differences in the amount and vitality of green vegetation.
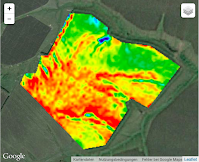
Variations Map
Characteristics: The variations product highlights the variations within the monitored parcel. It uses a colour bar, which is adjusted for each parcel individually or a set of parcels of the same crop to get the optimum visual representation of the variations. The product is currently also based on the NDVI. Border effects and spike values have been eliminated. The colour ranges from dark blue (low values) to bright red (high values).
Use Cases: The variations image is a visual tool for precision farming applications. It provides to non expert users indications about zones of conformity and non-conformity. For maximum use it requires interpretation by experts such as crop consultants.
Vitality Timeseries Statistics
Characteristics: The statistics allow to visualise and analyse a time series of the parcel from seeding to harvest.
Use Cases: The statistics graph visualises the development of the live green vegetation over time. Experts can interpret crop type, crop stages or crop anomalies from these graphs. It can be understood also by non experts.