Visible, Vitality and Variations products
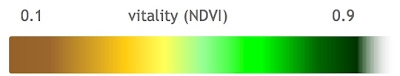
All our products are described here. Our Vitality and Variations products are based on the Normalized Difference Vegetation Index (NDVI). It is based on measurements of visible and near-infrared light and ranges from +1 to -1. Vegetative areas show always positive values, whereas bare soil and rocks approach „0“. The NDVI is (amongst others) a measure of plant vitality. It correlates with biomass, leaf area, chlorophyll content and plant health. It is explained in more detail, together with interesting remote sensing basics here.
The following picture shows the three products on an example field with uneven pivot irrigation patterns in Arizona (US) on March 22, 2016:
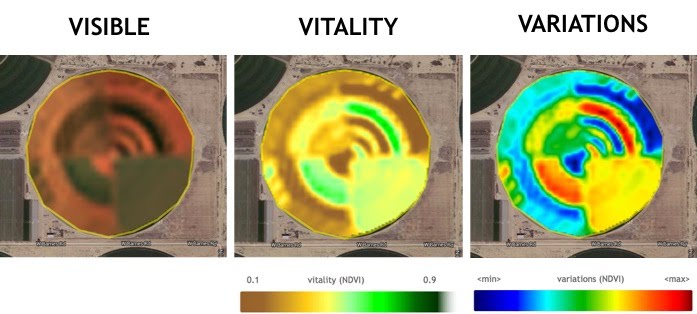
The Visible product is the true-colour combination of three satellite channels (RGB), similar to how the human eyes might see the field.
Our Vitality and Variations products show differences in plant vitality that we cannot necessarily see with our eyes. Therefore they can show crop damage before we can see it in the field.
The Vitality product is scaled between 0 (bare soil) and 1 (peak growing). It mainly shows the actual growth of the crop, but also already indicates within-field variations of growth. It allows to follow the plant vitality over time when a crop is growing as the scaling is always the same.
The Variations product is scaled between the minimum and maximum NDVI of every single field for a certain date. It therefore shows in a very pronounced way these within-field variations for one day. They may occur due to natural soil inhomogeneity, management practices, plant diseases or natural hazards. The comparison of different fields or days ist not very meaningful with this product.
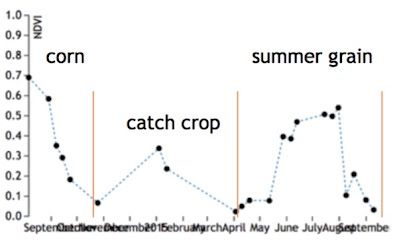
A typical time series of NDVI over the course of one year for different crops in Central Europe looks like this:
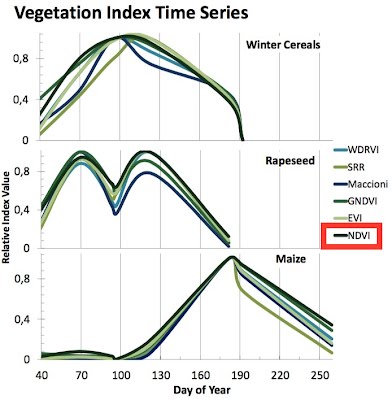
(Gerstmann et al. 2014)
The NDVI steadily increases during the growth period (maybe interrupted in winter for winter cereals or bloom as with rapeseed) and reach the maximum just before the start of ripening. The NDVI starts to decrease when ripening sets in and reaches its minimum at harvest.
In the following some exemplary cases are presented, illustrating where our products can offer helpful information to analyze crop growth and trigger management action:
Case 1: In-field variations of crop growth
Purpose: Determine if there are regions in a field that develop worse than the average and therefore have less biomass, leaf area and/or chlorophyll content.
Possible action: Trigger management action (fertilization, irrigation, pest management)Approach:
- Visually interpret the Vitality or Variations product of a parcel for one time step, or
- Evaluate the Vitality statistics (e.g. standard deviation) of a parcel for one time step with an API query like this:
GET https://geocledian.com/agknow/parcels/<parcel-id>/vitality?key=kkk&statistics=true
Examples:
Biomass variability due to different crop development stages
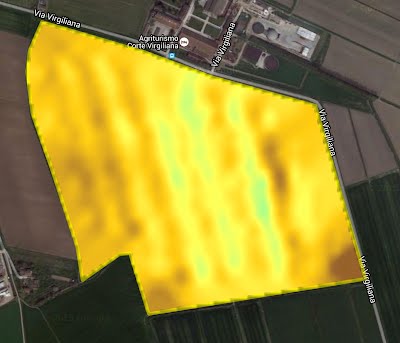
This Vitality image is from a field in Northern Italy, June 28, 2016. Here, the plant biomass is different due to different crop development stages:

Uneven plant development due to soil variability
This Vitality image is from a field in Arizona, March 22, 2016. Here, the plant development is uneven due to soil variability:

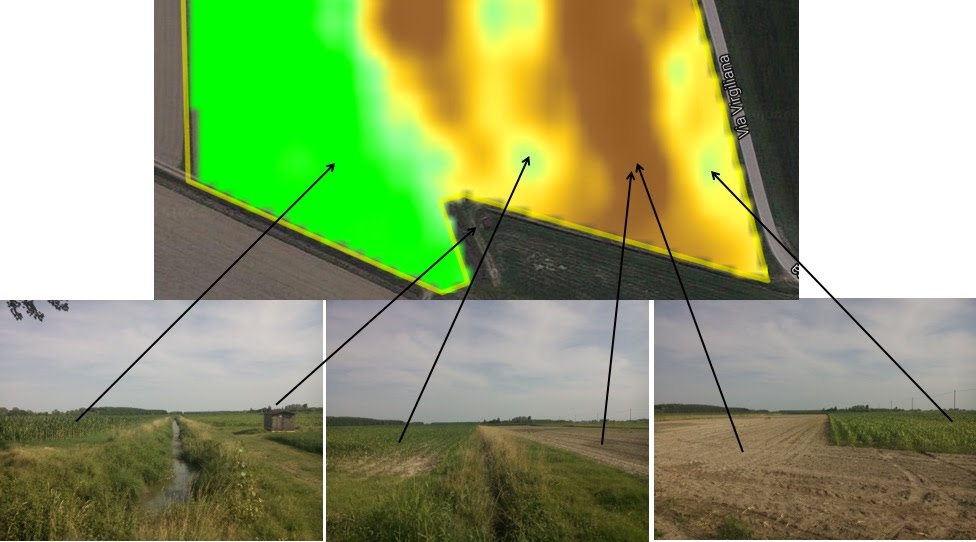
Effect of irrigation canals
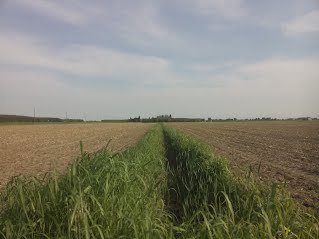
This Vitality image is from a field in Northern Italy, January 1, 2015. It shows a mostly bare field with vegetated irrigation canals that slightly raise the NDVI:

So the canals look in real (ca. 0.5 m diameter):
Uneven irrigation patterns
Comparing the Vitality image (MIDDLE) of this irrigated field in Arizona, March 22, 2016 to the Visible (LEFT) and Variations image (RIGHT) indicates that certain features are only visible in the Vitality or Variations product.
Pests
A lice attack in winter wheat fields in Denmark, April 6, 2015. Comparing the Vitality image (MIDDLE) to the Visible (LEFT) and Variations image (RIGHT) suggests that certain features are only visible in the Vitality or Variations product. The yellow circles in the Vitality product show the areas where plants are damaged. It is explained in more detail in use case 3.
Complex cultivation patterns
This Vitality image is from a farm in Kenya on December 29, 2015. We can see trees (green spots), shrubland/forest (dark green areas), walkways (yellow lines) and crops in different development stages.

Case 2: Assessment of vitality over time
Purpose: Determine if a crop develops normally
Possible action: Trigger management action (fertilization, irrigation, pest management)
Approach:
If a crop develops normally the NDVI should follow more or less a crop-specific development curve as in the figure above. The NDVI will steadily increase during the growth period (maybe interrupted by winter for winter cereals or bloom as with rapeseed) and reach the maximum just before the start of ripening. The NDVI starts to decrease when ripening sets in and reaches its minimum at harvest.
Normally all pixels in a field should follow a similar NDVI curve with possibly different absolute values due to varying soil, nutrition or water conditions or management practices.
This can be evaluated by:
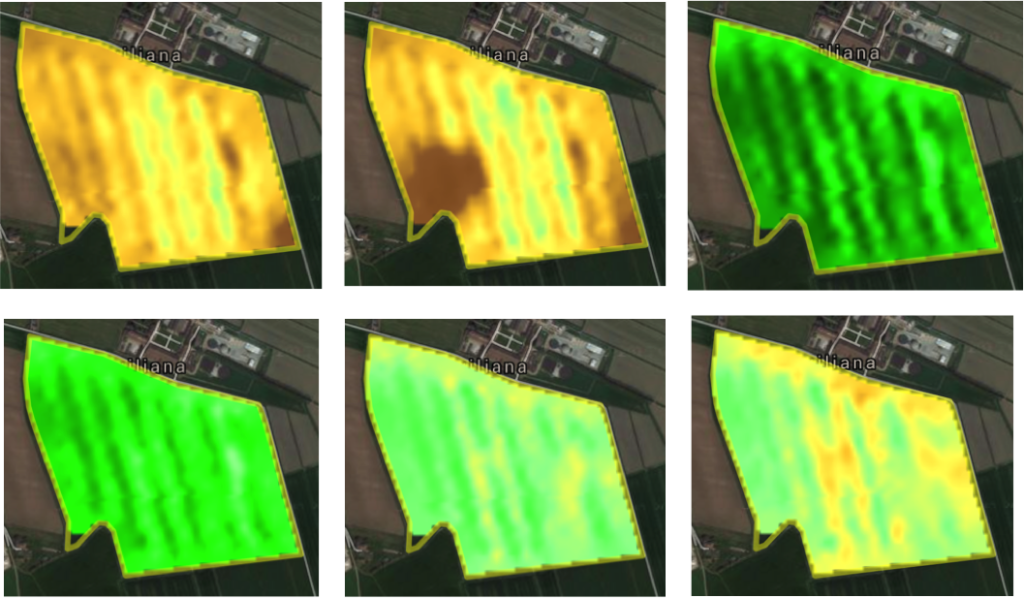
- Visually comparing the Vitality images for a parcel. A Vitality time series during growth and ripening should look like this:
- Looking at the whole Vitality time series in a film with our Time Analysis Widget. The available Vitality images are interpolated to produce a dense time series. This makes interpreting the time series very intuitive. This widget will be released soon in a new version! Here is a screenshot from the widget:

- Plotting the mean values for all time steps for a parcel from the statistics API query:
GET https://geocledian.com/agknow/parcels/<parcel-id>/vitality?key=kkk&statistics=true The plot should look like this:
You can use our Graph Widget to easily make this plot. This widget will be released soon!
Case 3: Document crop rotation and verify crop type
Purpose: Document the crop rotation for subsidy purposes or verify the crop type on a field
Possible action: Document activities
Approach:
The NDVI curves for certain crops show a typical pattern over time. This can be used to document the crop rotation on one field or to detect if a crop on a field develops like the typical pattern for this crop would suggest.
This can be evaluated by plotting the mean values for all time steps for a parcel from the statistics API query:GET https://geocledian.com/agknow/parcels/<parcel-id>/vitality?key=kkk&statistics=true
If you look at several crop cycles in a time series for one year it can look like this:
Case 4: Identification of crop damage in the NDVI time series
Purpose: Detect possible crop damages in a parcel
Possible action: Trigger management action (damage assessment, localization of damaged zones, pest management)Approach:
If crop damages (e.g. due to diseases, pests, hail, flood, drought) occur in a parcel the NDVI development will deviate from the expected NDVI curve. A damage could be indicated for instance by an early decrease or a slower increase of the NDVI during growth or an earlier decrease (i.e., NDVI maximum occurs before the normal ripening process starts). This can be the case for the whole parcel or only certain areas within the parcel. Identification is possible via:
- Visually interpreting the Vitality time series for a parcel and detecting areas with a NDVI decrease (or too slow increase) during the growth period
- Plotting the mean and/or standard deviation values for all time steps for a parcel from the statistics API query and detecting areas with a NDVI decrease (or too slow increase) during the growth period:
GET https://geocledian.com/agknow/parcels/<parcel-id>/vitality?key=kkk&statistics=trueExamples:
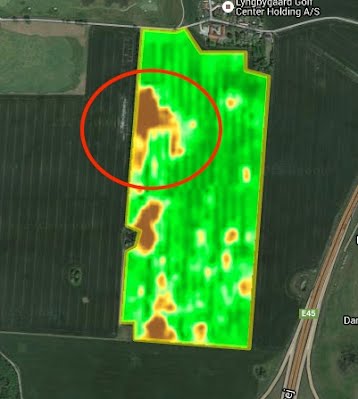
Lice attack
A lice attacked these winter wheat fields in Denmark, April 2015:

On this Winter Wheat field a lice attack becomes visible in the Vitality images in April 2015. Until February the field looks rather normal, but on April 6 a lot of round yellow spots appear that indicate worse plant vitality. These were caused by a lice attack. Even in June, just before harvest, some spots are still visible because the affected plants are still less vital than the rest of the field. Yield was certainly affected.
Below is the NDVI development from October 2014 – August 2015. The lice attack is not visible relying solely on this plot without additional information, even though the standard deviation (bars) is highest on the dates in April.
Floods
A severe flood hit this Canola field in Czech Republic in 2013 (RGB images):
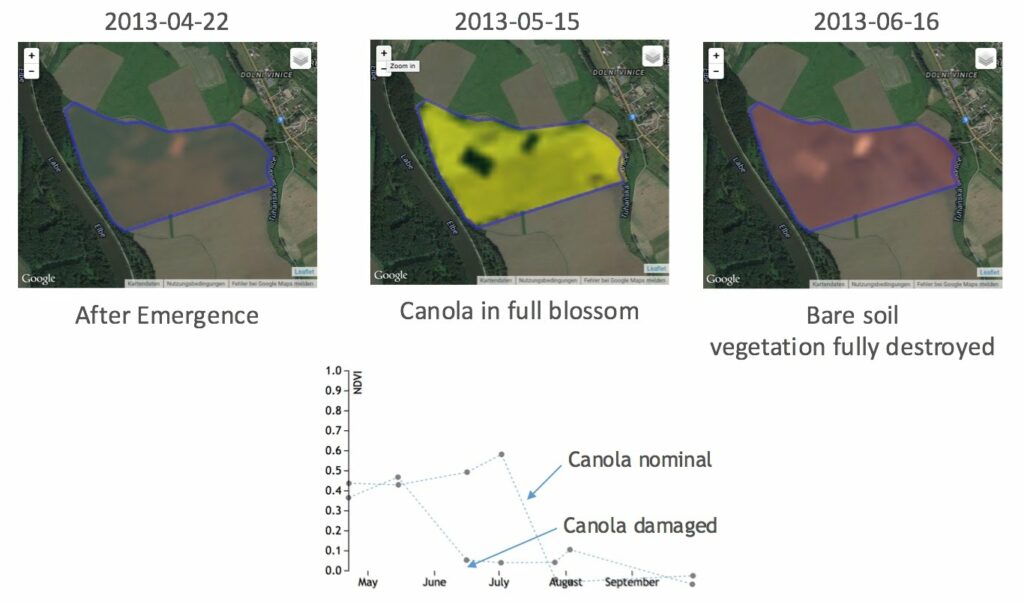
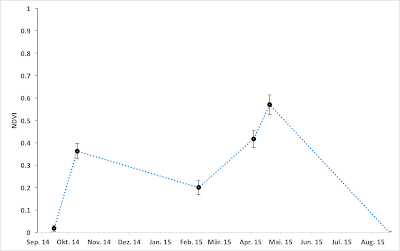
On this Canola field in Czech Republic one can follow the effects of a severe flooding of the Elbe river. The field is developing normally until the mid of May 2015. On May 15 the field is in full blossom, the mean NDVi is around 0.4. One month later the NDVI is down to less than 0.1 because the plants have been destroyed completely by a severe flood. The soil is more or less bare. Compared to a field that developed normally it becomes obvious that the NDVI decreased roughly two months too early.
Snail attack
The circle visible in this image of a winter wheat field in Denmark on May 10, 2016 is an attack of a small snail that drastically reduces the biomass of the affected plants by eating the leaves:

This snail attack was discovered by the farmer in the field. Using our imagery he was able to assess the dimension of the problem and plan actions accordingly.
Case 5: Assess crop health
Purpose: Detect possible nitrogen deficiency in a parcel
Possible action: FertilizationApproach:
Very similar to the above case. If a nutrient deficiency occurs in a parcel the NDVI development can deviate from the expected NDVI curve. A damage could be indicated for instance by an early decrease or a slower increase of the NDVI during growth or an earlier decrease (i.e., NDVI maximum occurs before the normal ripening process starts). This can be the case for the whole parcel or only certain areas within the parcel. Identification is possible via:
- Visually interpreting the Vitality time series for a parcel and detecting areas with a NDVI decrease (or too slow increase) during the growth period
- Plotting the mean and/or standard deviation values for all time steps for a parcel from the statistics API query and detecting areas with a NDVI decrease (or too slow increase) during the growth period:
GET https://geocledian.com/agknow/parcels/<parcel-id>/vitality?key=kkk&statistics=trueExample:
Nitrogen deficiency
A nitrogen deficiency occurred in these winter wheat fields in Denmark, April 2014:
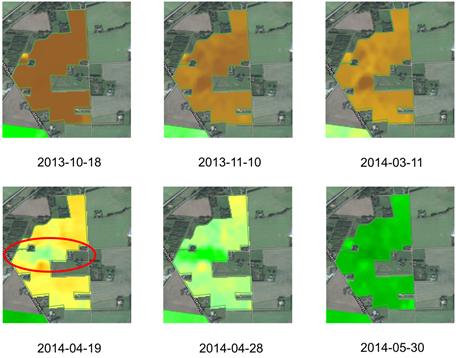

On this Winter Wheat field a nitrogen deficiency leads to large areas in the field that develop worse than the central part (highlighted in red). Until March this is not very pronounced yet, but in April it is clearly visible that the central part of the field is much greener (= more vital) than the upper and lower parts of the field. Towards the end of the season, around end of May, this inequality has mostly disappeared.
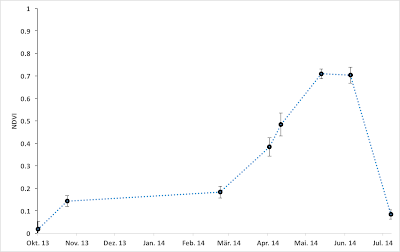
Below is the NDVI development from November 2013 – July 2014. The nitrogen deficiency is not visible relying solely on this plot without additional information, even though the standard deviation (bars) is highest on the dates in April.
Case 6: Detection of field management zones
Purpose: Analyse longterm patterns of plant vitality due to soil variability (independent of crop or management practices) to derive field management zones
Possible action: Plan & Regulate management action (fertilization, irrigation), optimise soil sampling
Approach:
- Integration of Variations product over the complete time series that’s available, over different years and crops
- Highlighting areas that are always performing better and worse
- Soil variability becomes visible
- This is being done for the Management Zones product that will be released later this year
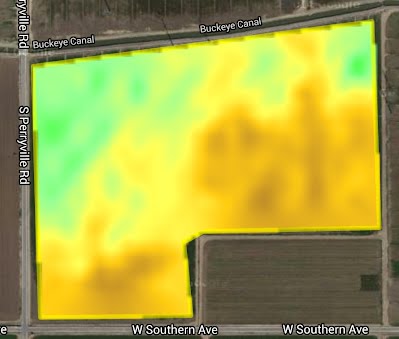
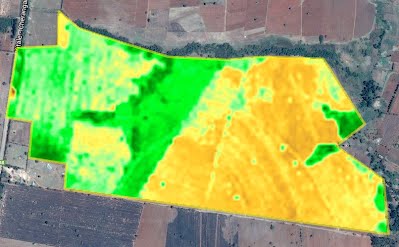
An example of the Management Zones product is shown below for a parcel in Northern Italy.
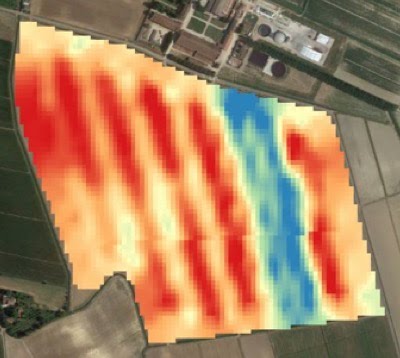
This image shows very well the low performing and the high performing zones for this parcel. Blue zones show areas with low growth potential, red zones with high potential.
Case 7: Compare crop development in different years
Purpose: Get a feeling for crop development on a specific parcel in this year compared to last years
Possible action: Estimate potential yield for this year (e.g. 20% less than last year)Approach:
- Plotting the NDVI mean values for a parcel for several years with the same crop from the statistics API query:
GET https://geocledian.com/agknow/parcels/<parcel-id>/vitality?key=kkk&statistics=true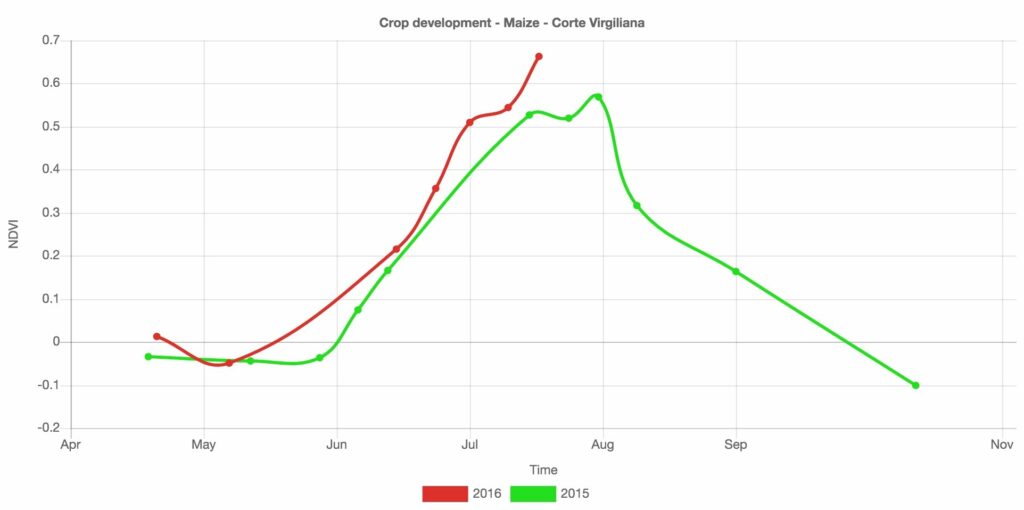
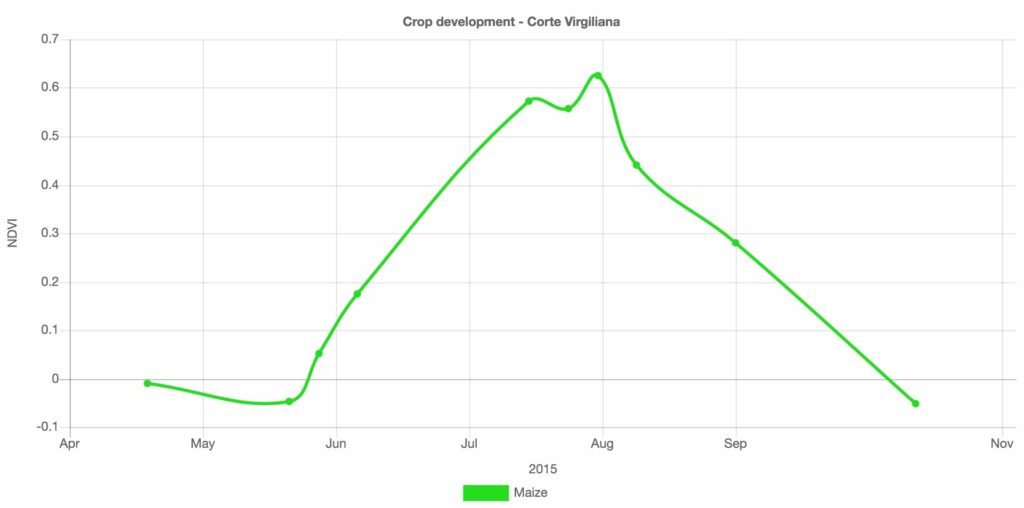
In this example we see the NDVI development for the seasons 2015 and 2016 from April to October for a field that was planted with Maize in Northern Italy for both seasons. It can be clearly seen that the development looks different every year. The NDVI curve differs in beginning of green-up, maximum increasing slope, as well as the absolute values.
- Estimate the effects on potential yield with local expert knowledge about the last years‘ yields
Case 8: Comparison of annual crop growth for different parcels
Purpose: Get a feeling for crop development on a specific parcel compared to other parcels
Possible action: Estimate the performance difference between 2 parcels (e.g. because of soil, different variety/crop, management practice)
Approach: Analogous to above, only that different parcels are compared.
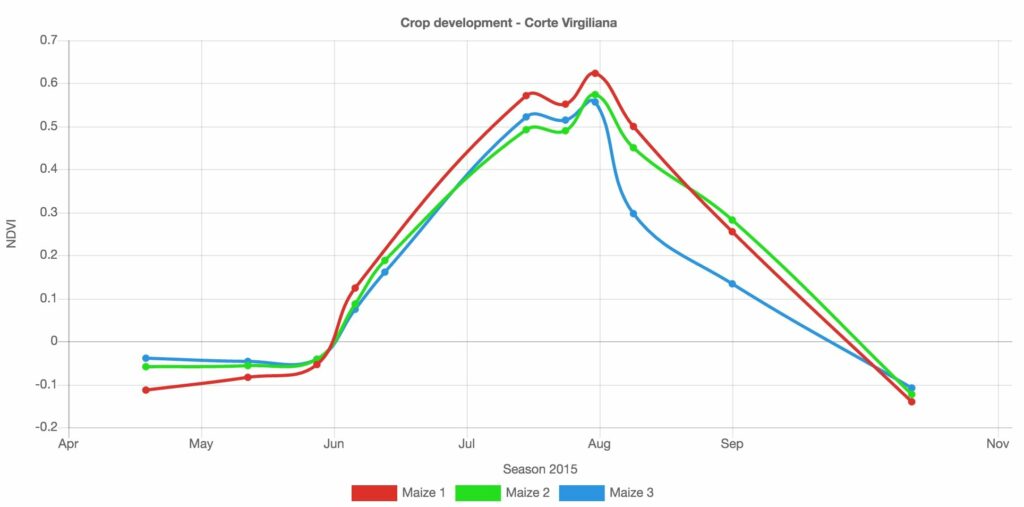
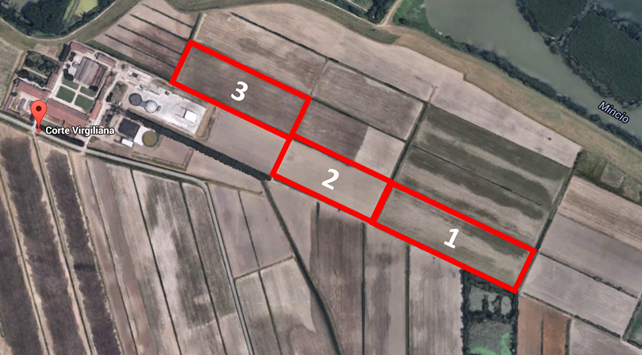
In this example we see the mean NDVI development for three different maize fields on a farm in Northern Italy from April to November 2015. The NDVI curves differ slightly and the farmer can relate this to observed differences in yield. Obviously field 3 (blue) is ripening faster than the other two. This is also obvious if we compare the Vitality images from field 1 (left) and 3 (right) during ripening in August:
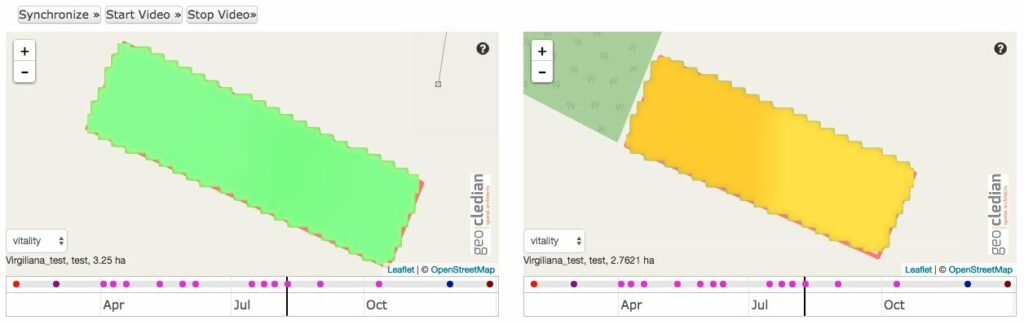
Field 3 gets yellow earlier and faster than field 1. Our Time Analysis Widget can also be used to link several widgets together and do detailed comparisons between fields. Following figure illustrates the location of the fields:
Case 9: Drought detection
A drought occurred in Central Europe in 2018. We did a detailed data analysis of an area in Central Germany to show you how to detect and monitor drought effects with the help of our data. This is described here.
Outlook
We will work out additional use cases in the future and present them here. These could be:
- Analyse if the NDVI time series fits to the specified crop
- Analyse how the NDVI time series of a parcel with a specified crop fits to the average development of the same crop in the area
- Compare NDVI time series with meteorological data (and/or drought index)
- Retrieve specific dates from NDVI time series (Flowering, Harvest)
- Retrieve crop damage from NDVI time series and issue warning
References
- Gerstmann, H., Möller, M., Thürkow, D., Gläßer, C.: Phenological structuring of Sentinel-2 data for determination of optimal acquisition dates for field crop classification, Sentinel-2 for Science Workshop, 20-22 May 2014, Frascati (Roma), Italy.