NDVI
The vegetation index behind our Vitality and Variations product is the Normalized Difference Vegetation Index (NDVI), firstly used by Rouse et al. (1973). The NDVI uses the fact that healthy vegetation reflects a large portion of the near infrared light (NIR) and absorbs most of the visible part of the spectrum, in particular the red (RED).
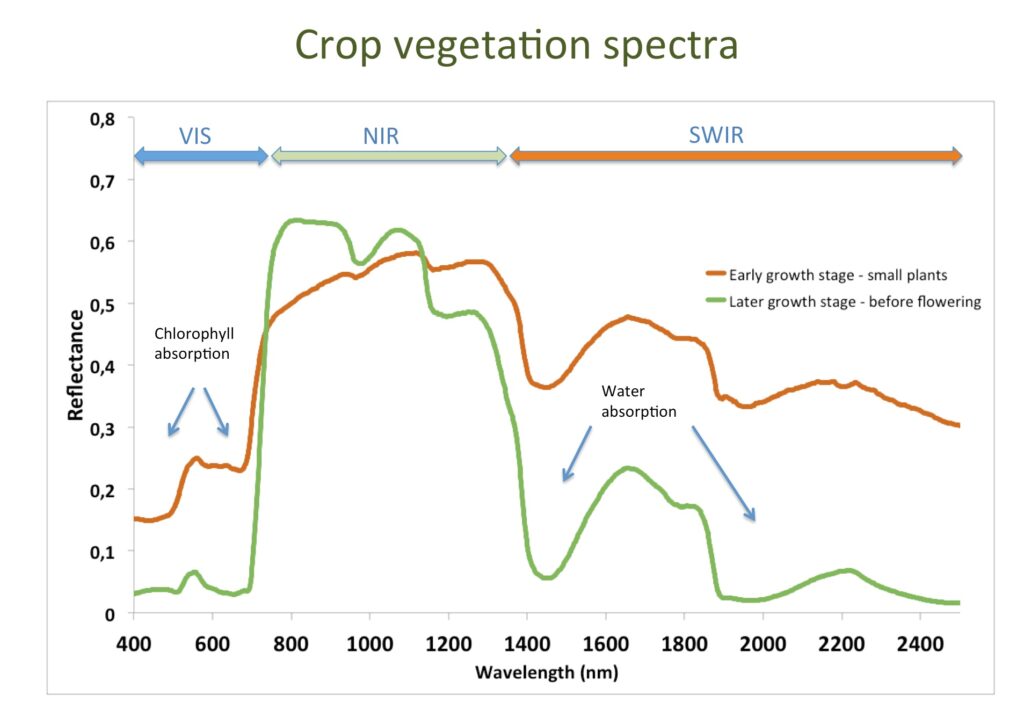
The following figure shows two typical vegetation spectra, one for small plants and high soil visibility and the other with the mature crop covering all soil. Chlorophyll absorption bands in the visible, the pronounced reflectance in the NIR, and the water absorption bands in the shortwave infrared region of the spectral domain are presented.

The NDVI is calculated as:
NDVI = (NIR – RED)/(NIR + RED)
NDVI is scaled between -1 and +1. Negative values may only occur for water, soil coverages are usually around zero and positive values represent vegetation surfaces.
Values of NDVI can be influenced by a range of different factors:
- plant vitality (depending on nutrition status, water, soil and light availability)
- type of crop (specific canopy structure)
- crop development stage (stem elongation, leaf development, tillering, bloom etc.)
- possible measurements effects (noise, different sensors, atmospheric effects etc.)
The index has been used in numerous studies analyzing various vegetation issues by means of different remote sensors.
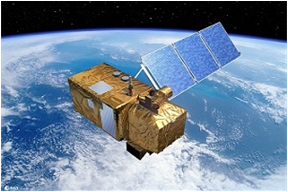
With the launch of the first Sentinel-2A sensor by ESA in 2015, a continuity of land cover monitoring will be guaranteed providing a global coverage every 10 days. This will be enhanced to 5 days and even 2-3 days in mid-latitudes with the launch of Sentinel-2B sensor in 2017. Sentinel-2 looks like this:

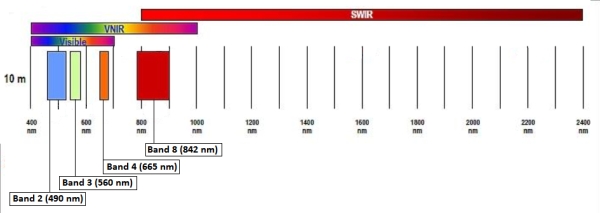
One of the big advantages of the new data source will be the possibility to produce NDVI time series of agricultural land in high spatial resolution (10 m x 10 m). The NDVI can be calculated from S2-band 4 (665nm) located in the RED and S2-band 8 (842nm) located in the NIR region of the spectral domain:

